We use cookies to personalize content and analyze traffic. We share information about your usage with our partners, who may combine it with other data.
Read more

INB Team
August 21, 2026


A strong payout, a promising GEO, and ready-to-use creatives – it may seem like the offer is ready to launch. But the first leads often raise even more questions: is the funnel really weak, or are you drawing conclusions too early?
This is exactly where it is easy to lose money: either by shutting down a campaign too soon, even though it could still become profitable, or by continuing to spend on a test that no longer has any real chance of success.
In this article, the INB.bio team will explain how to test a new affiliate offer, how much money to allocate at the start, how many leads to collect, which metrics to evaluate, and how to understand whether an offer is ready for scaling.
A good payout and a high approval rate do not automatically mean that an offer will be profitable for you. What worked for another team may not work at all with your traffic, and vice versa.
The reason is simple: an offer does not work separately from the rest of the funnel. What matters is who you bring in, what promise you make in the ad, and what the user sees after landing on the page.
For the same reason, a cheap lead is not always a better lead. For example, one campaign may generate applications at $2 each, but only a small percentage of them are confirmed. Another campaign may bring leads at $4, but most of them are high-quality and convert well through the call center. In the end, more expensive traffic may generate a higher profit.
That is why it is important to understand how to test affiliate offers before scaling. This allows you to stop wasting time searching for the “perfect” product, test hypotheses quickly, and keep only the ones that have real profit potential.
A test budget should answer the main question: can the offer generate profit with your traffic? That is why you should not simply choose an amount you are comfortable losing. You need to estimate in advance how much one lead may cost and how much data you want to collect.
To do this, you need to consider two metrics: the payout for a confirmed order and the expected approval rate.
Here are several examples of INB.bio offers:
These figures help you calculate the limit above which buying a lead is no longer profitable.
Maximum lead cost = payout × expected approval rate.
For Prolan:
$11 × 20% = $2.20.
For JointHealth:
$23 × 23% = $5.29.
For ProGuard:
$22 × 26% = $5.72.
This is not the target lead cost. It is the break-even point. If an application costs as much as it generates on average, there is no profit left.
That is why it is better to target 60–75% of the maximum lead cost during the test. For example, for ProGuard, this would be approximately $3.40–$4.30 per lead. After that, you can calculate the full affiliate offer testing budget:
Test budget = planned number of leads × expected lead cost.
If you want to collect 40 applications at $4 each, you will need approximately $160 for the test.


One of the most common mistakes is drawing conclusions after only 5–10 applications. With such a small sample, the approval rate may look completely different from one day to another: today, three orders out of five are confirmed; tomorrow, none out of six. This is not yet a trend. It is simply normal fluctuation within a small sample.
To understand how many leads to test an offer, you should not focus on the first day of the launch. Instead, look at the minimum volume required to see actual performance data rather than random numbers.
With a sample of 30–50 applications, you can already see whether the actual approval rate is moving toward the expected range. For INB.bio offers, it usually falls between approximately 16% and 26%, depending on the GEO, product, and traffic quality.
Suppose you send 40 leads to an offer with an expected approval rate of 20%. The expected result would be around eight confirmed orders.
If seven or nine orders are confirmed, this is a normal deviation. If only two are confirmed, the result should no longer be dismissed as random. However, before making a final decision, you should check the traffic source, creatives, landing page, and the quality of the applications themselves.
At a volume of 70–100 leads, the evaluation becomes more accurate. You can already see whether the approval rate remains stable, whether the lead cost increases after spending more, and whether the initial result depended on a single successful day.
At the same time, there is no reason to collect hundreds of leads if the first 40–50 show an obvious failure. If the lead cost is significantly above the acceptable limit and the number of confirmations is several times lower than expected, additional budget is unlikely to change the situation.
The purpose of a test is to collect enough data to make a decision, not to spend every last dollar of a predetermined budget.

During testing, you should not look only at the lead cost or only at the approval rate. Each metric on its own shows just one part of the picture. To understand whether a campaign has potential, you need to evaluate three metrics together:
It is the combination of these metrics that shows whether the campaign is actually making money rather than simply generating cheap applications.
Cost per lead shows how much you spend on one application. The calculation is simple:
Cost per lead = advertising spend ÷ number of leads generated.
For example, you spent $120 and received 40 applications: $120 ÷ 40 = $3 per lead.
A $3 lead cost does not tell you on its own whether the result is good or bad. For Prolan, with an $11 payout and a 20% approval rate, this cost would already be too high because the maximum lead cost for this offer is around $2.20.
For ProGuard, with a $22 payout and a 26% approval rate, a $3 lead looks much better because its maximum lead cost is approximately $5.72.
That is why the lead cost should always be compared with the payout and the actual confirmation rate.
The approval rate shows what percentage of submitted applications turned into confirmed orders.
Approval rate = number of confirmed orders ÷ number of submitted leads × 100%.
If the call center confirms 10 orders out of 50 leads: 10 ÷ 50 × 100% = 20%.
For the Prolan offer, this matches the expected benchmark. For ProGuard, where the average approval rate is 26%, this result would already be below expectations.
Across INB.bio campaigns, the working approval range for different GEOs is usually between 16% and 26%. However, you should compare your result not with the general average but with the specific offer and country.
A low approval rate does not always mean that the product is the problem. Possible reasons include:
That is why, before stopping a campaign, you need to check where the applications are coming from and which creatives are producing the weakest results.
Earnings per click shows how much revenue each click on your link generates on average.
Earnings per click = total revenue ÷ number of clicks.
Suppose a campaign received 1,000 clicks, while confirmed orders generated $180: $180 ÷ 1,000 = $0.18 per click.
This metric should be compared with the cost per click. If you pay an average of $0.14 per visit and generate $0.18 in revenue, the campaign has positive unit economics. If a click costs $0.22, the test is still unprofitable.
Earnings per click is especially useful when comparing several creatives. One may generate cheap clicks but almost no confirmed orders. Another may cost more but attract users who are more likely to make a purchase.
That is why we recommend evaluating performance in the following order during the test:
If all metrics remain within an acceptable range, the funnel has potential. If one of them drops, you need to understand the reason rather than automatically shutting the campaign down.
🌿 Read also: “CPA Payouts: What They Mean and How Much You Can Actually Earn”
The question of when to kill an affiliate campaign should not depend on your mood or one bad day. The decision should be based on a specific number of leads and actual performance metrics.
Stop the test if, after 40–50 leads, the approval rate is below 10% and the cost per lead has already exceeded the break-even limit.
For example, suppose you are testing JointHealth in Côte d’Ivoire. The benchmark approval rate is 23%, while the maximum acceptable lead cost is approximately $5.29. After 50 applications, you receive only four confirmed orders. The actual approval rate is 8%, and each lead costs $6. In this situation, the campaign is failing on two key metrics at once. There is no point in continuing without making major changes.
You should also stop the test if:
A poor start does not always mean that the offer should be switched off immediately. If the result is close to a workable level, it is better to check the main elements of the funnel first.
For example, ProGuard in Tunisia has an approval rate benchmark of 26%. If you receive eight confirmed orders from 40 leads, the actual result is 20%. This is below the average benchmark, but it does not look like a complete failure.
In this situation, you should optimize the campaign first:
Continue optimizing if, after 30–50 leads, the approval rate is no more than 20–25% below the benchmark and the cost per lead remains within the acceptable range.
Do not change the creative, audience, landing page, and campaign settings all at once. If you do, you will not understand what exactly affected the result. Change one element, collect a new sample, and compare it with the previous one. This way, the test will give you an answer instead of producing even more random numbers.
The main signal for scaling is stability. You should see not a random spike, but the same performance pattern over several days:
An offer can be prepared for scaling if, after 70–100 leads, the approval rate is close to the benchmark and the campaign remains profitable for several consecutive days.
For example, suppose you are testing ProGuard in Tunisia. After 80 leads, you reach a 25% approval rate against a 26% benchmark, while the lead cost remains at $3.80. The maximum lead cost for this offer is approximately $5.72, so the funnel still has a healthy margin.
However, you should not multiply the budget several times in a single day. The advertising system may begin targeting a broader but less interested audience, causing the cost per lead to rise and the approval rate to fall.
It is safer to scale gradually:
It is also important not to depend on a single ad. Even a strong creative loses effectiveness over time: the audience sees it more often, clicks less, and the cost of traffic increases. That is why it is better to have at least two or three proven variations before scaling.
The same applies to the landing page. If the entire campaign depends on one creative or one page, any technical issue or drop in conversion rate can immediately damage the result.
When you understand how to test affiliate offers before scaling, increasing the budget stops being a gamble. You are no longer trying to guess whether the funnel can handle more volume. Instead, you verify it through small, controlled steps.
🌿 Learn more about free traffic sources for affiliate marketing in our article.
Even accurate calculations cannot reveal every detail of a specific GEO. Approval rates change, the cap may fill up quickly, and an offer that performed well yesterday may require a different approach today.
That is why it is better not to act blindly before your first launch. Ask your manager:
An INB.bio manager will help you choose an offer based on your traffic source, experience, and budget. The test itself will still be your responsibility, but you will not be starting from scratch. You will already have up-to-date data and a clear plan.
Do not wait for the perfect moment. Register with INB.bio for free, get recommendations from experienced affiliate managers, and launch your first test with a clear understanding of what exactly you are evaluating.

The budget depends on the expected cost per lead and the number of applications you plan to collect. For an initial evaluation, you usually need 30–50 leads. For example, if one lead costs approximately $4, you should allocate around $120–200 for the first test.
It is too early to draw conclusions after 5–10 applications because the approval rate can fluctuate significantly within such a small sample. You can conduct an initial evaluation after 30–50 leads. To decide whether to scale, it is better to collect 70–100 applications and check whether the metrics remain stable for several days.
There is no universal benchmark, so you should compare your result with the expected approval rate for the specific offer and GEO. For INB.bio offers, the approval rate usually ranges from 16% to 26%. The main requirement is that the campaign remains profitable at the actual cost per lead.
At the beginning, it is better to launch one GEO, especially if your budget is limited. This prevents you from mixing different traffic costs, audience behavior, and approval rates. You can test several GEOs in parallel if you have enough budget.
We operate across 15+ countries with low competition and exceptional profit potential. Our focus covers high-growth regions for scalable traffic and conversions.


3+ offers

22% app.

2+ offers
23% app.

15+ offers
24% app.

9+ offers
24% app.

8+ offers
23% app.

2+ offers
21% app.

1+ offers
16% app.

3+ offers
20% app.
Our product line is built for results: every offer is tested, localized, and ready to scale.

Joints

Pakistan
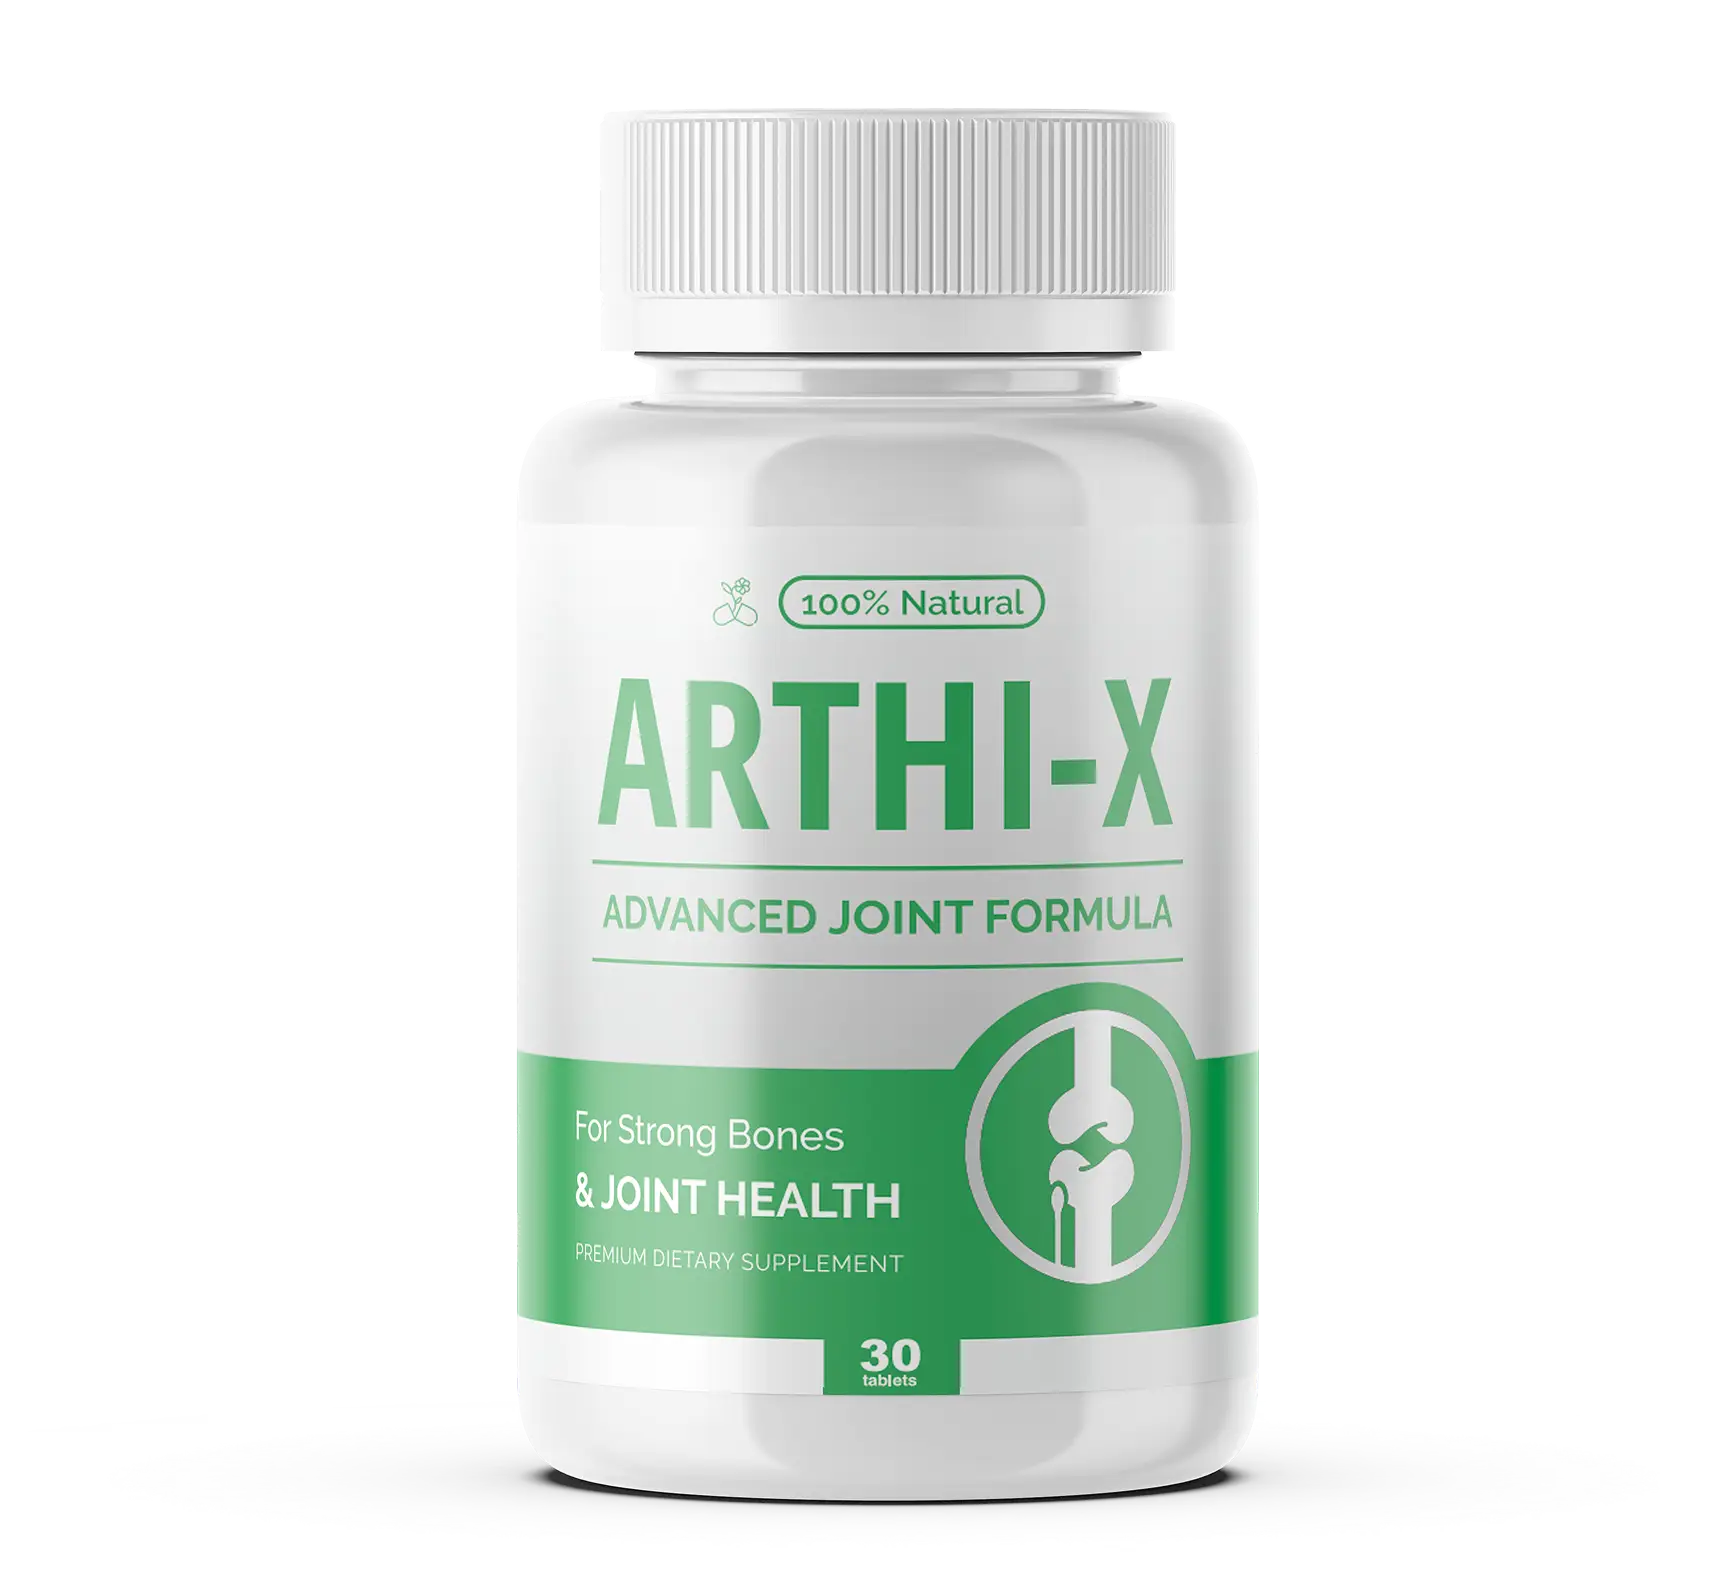
$11
/lead
Joints
Ivory Coast

$23
/lead
Joints
Kenya
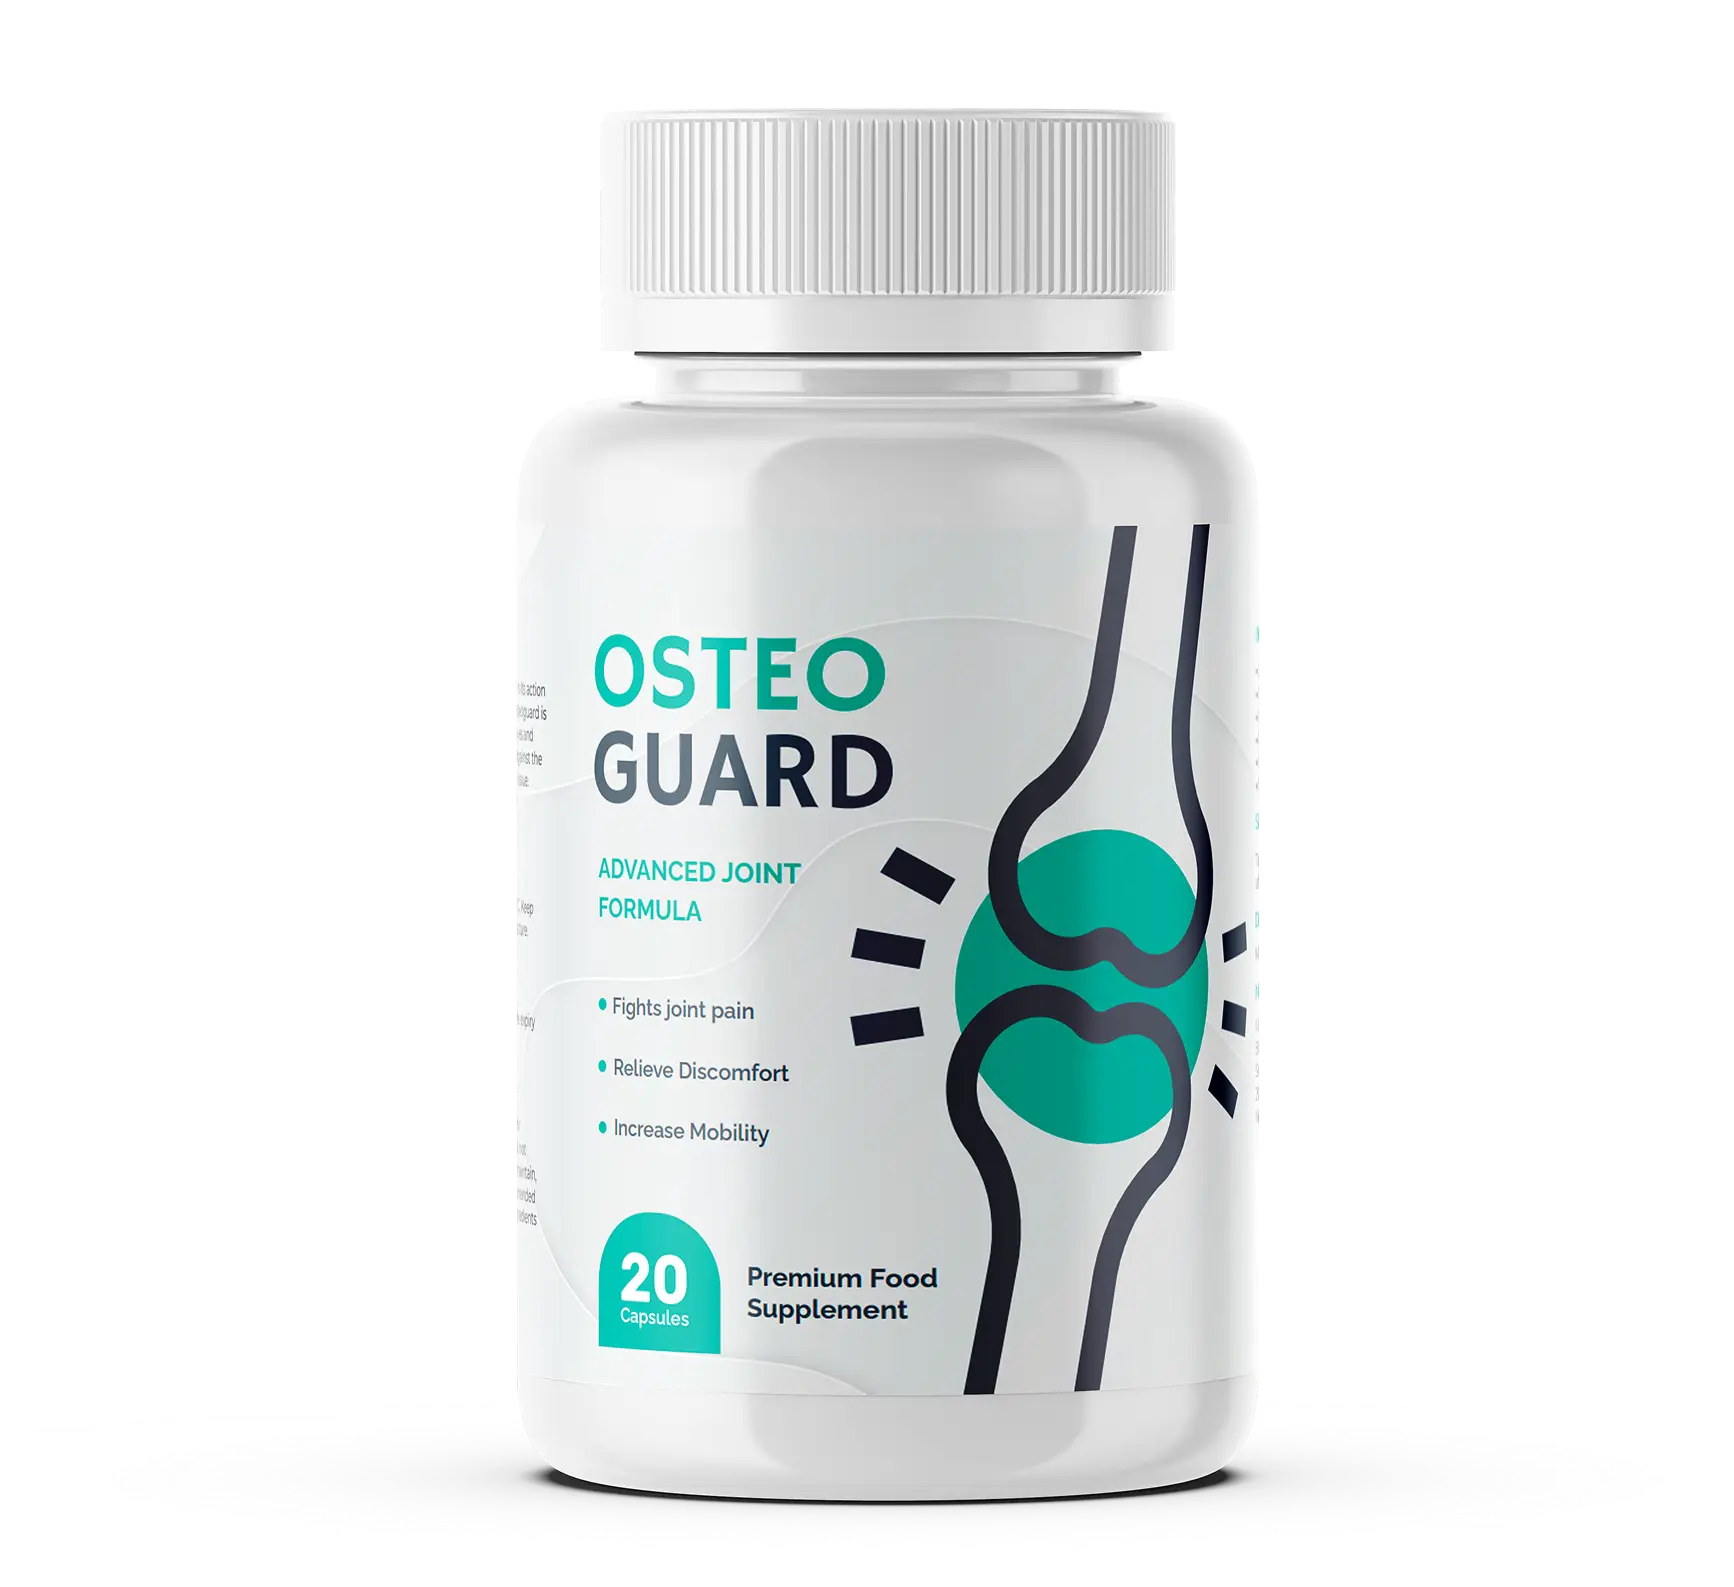
$18
/lead
Cardiology
Morocco
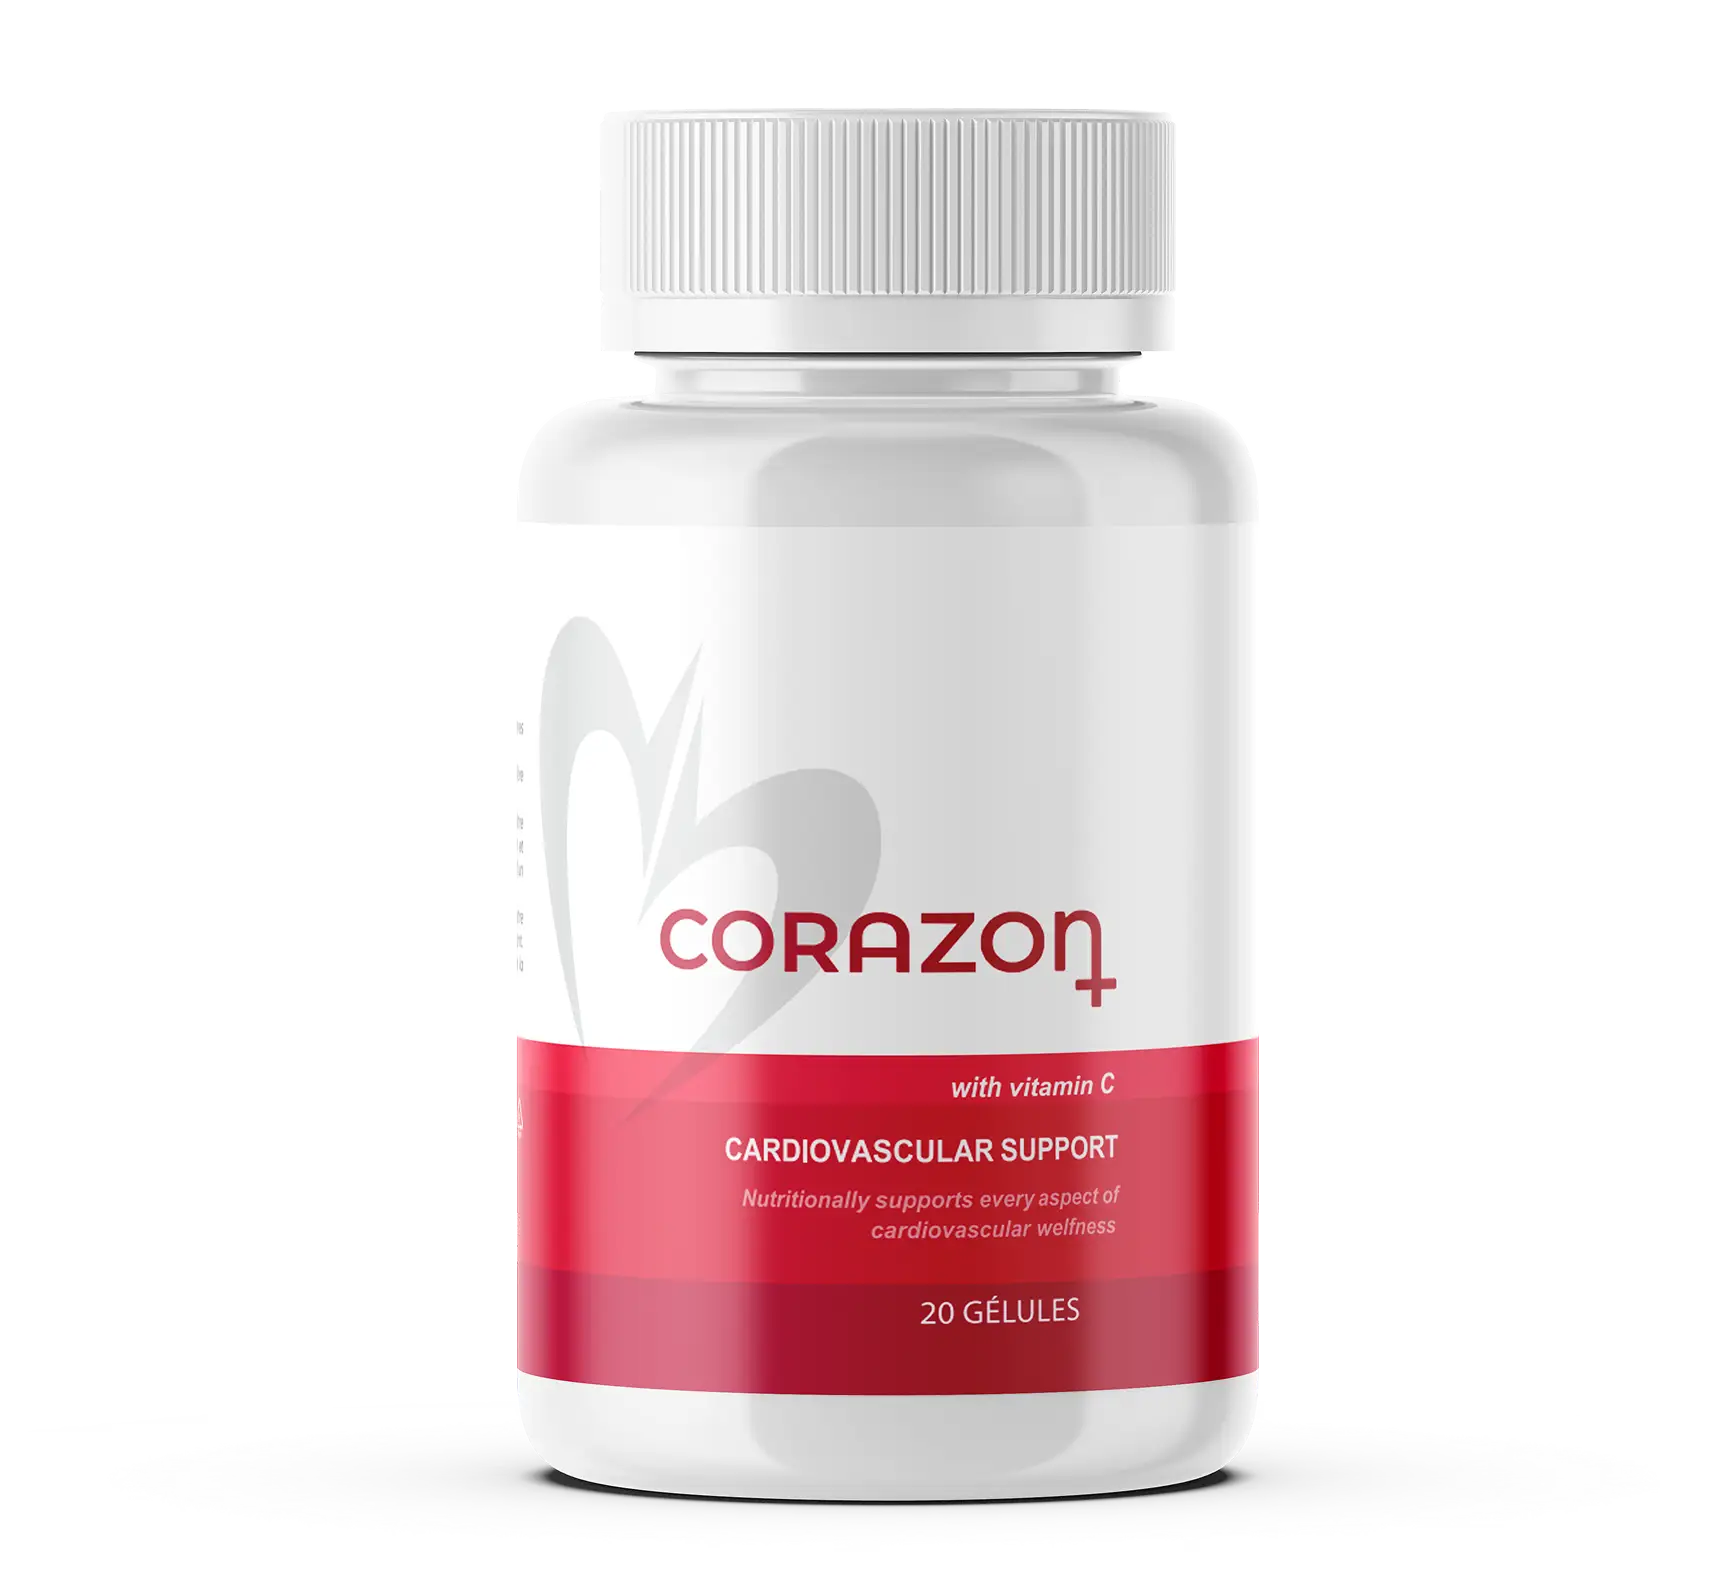
$21
/lead
Prostatitis
Morocco

$20
/lead
Hair
Morocco
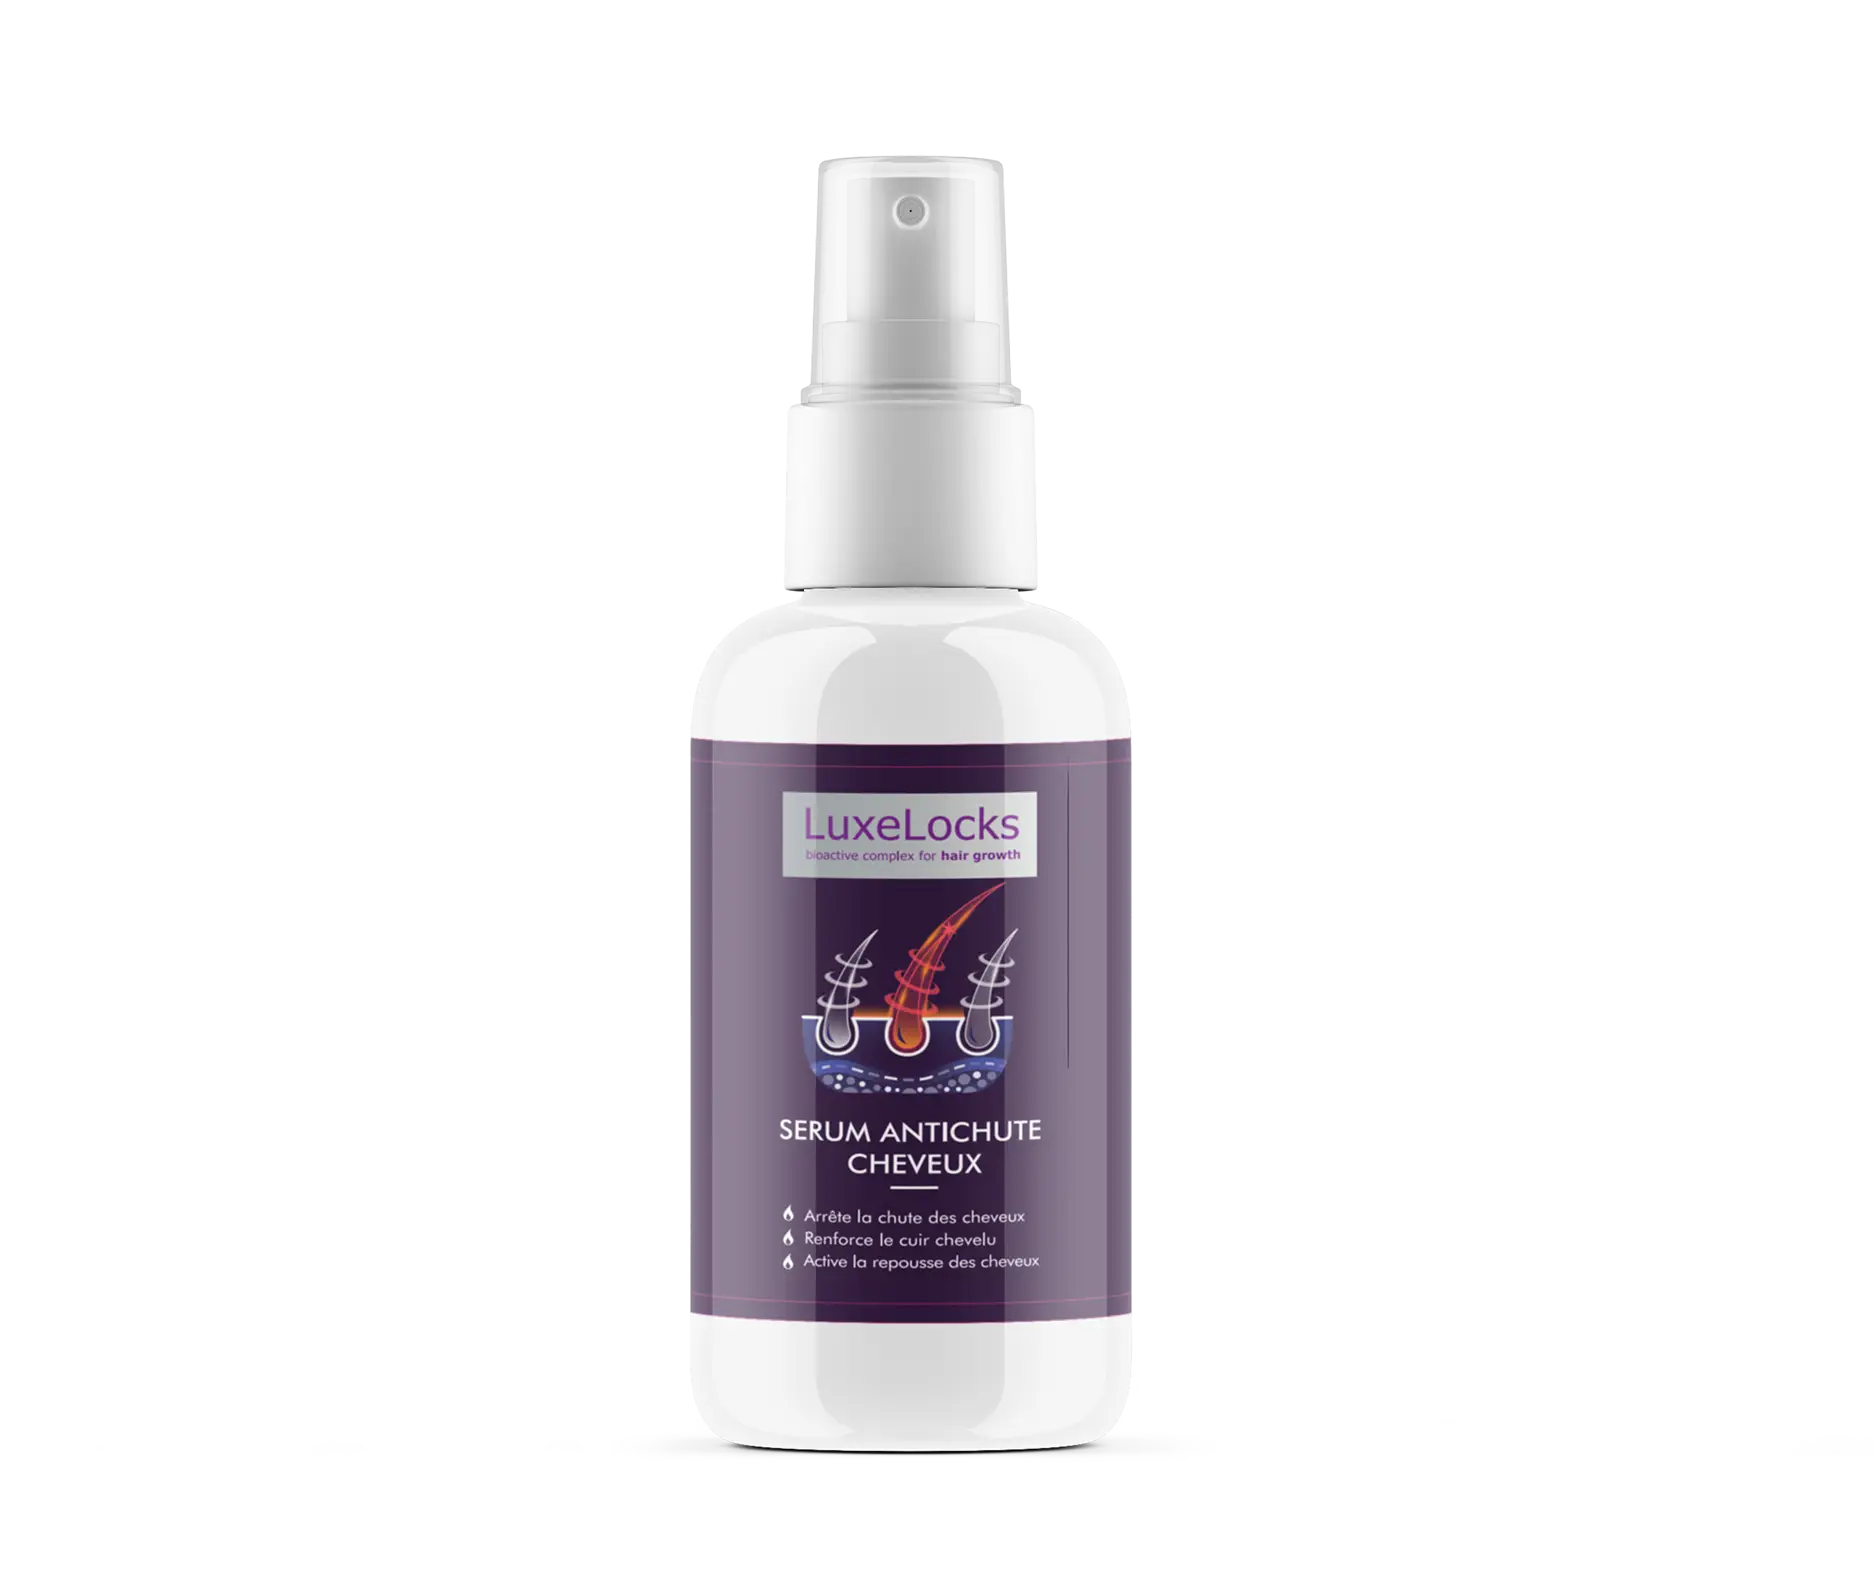
$18
/lead
Joints
Ivory Coast

$23
/lead
Cardiology
Ivory Coast
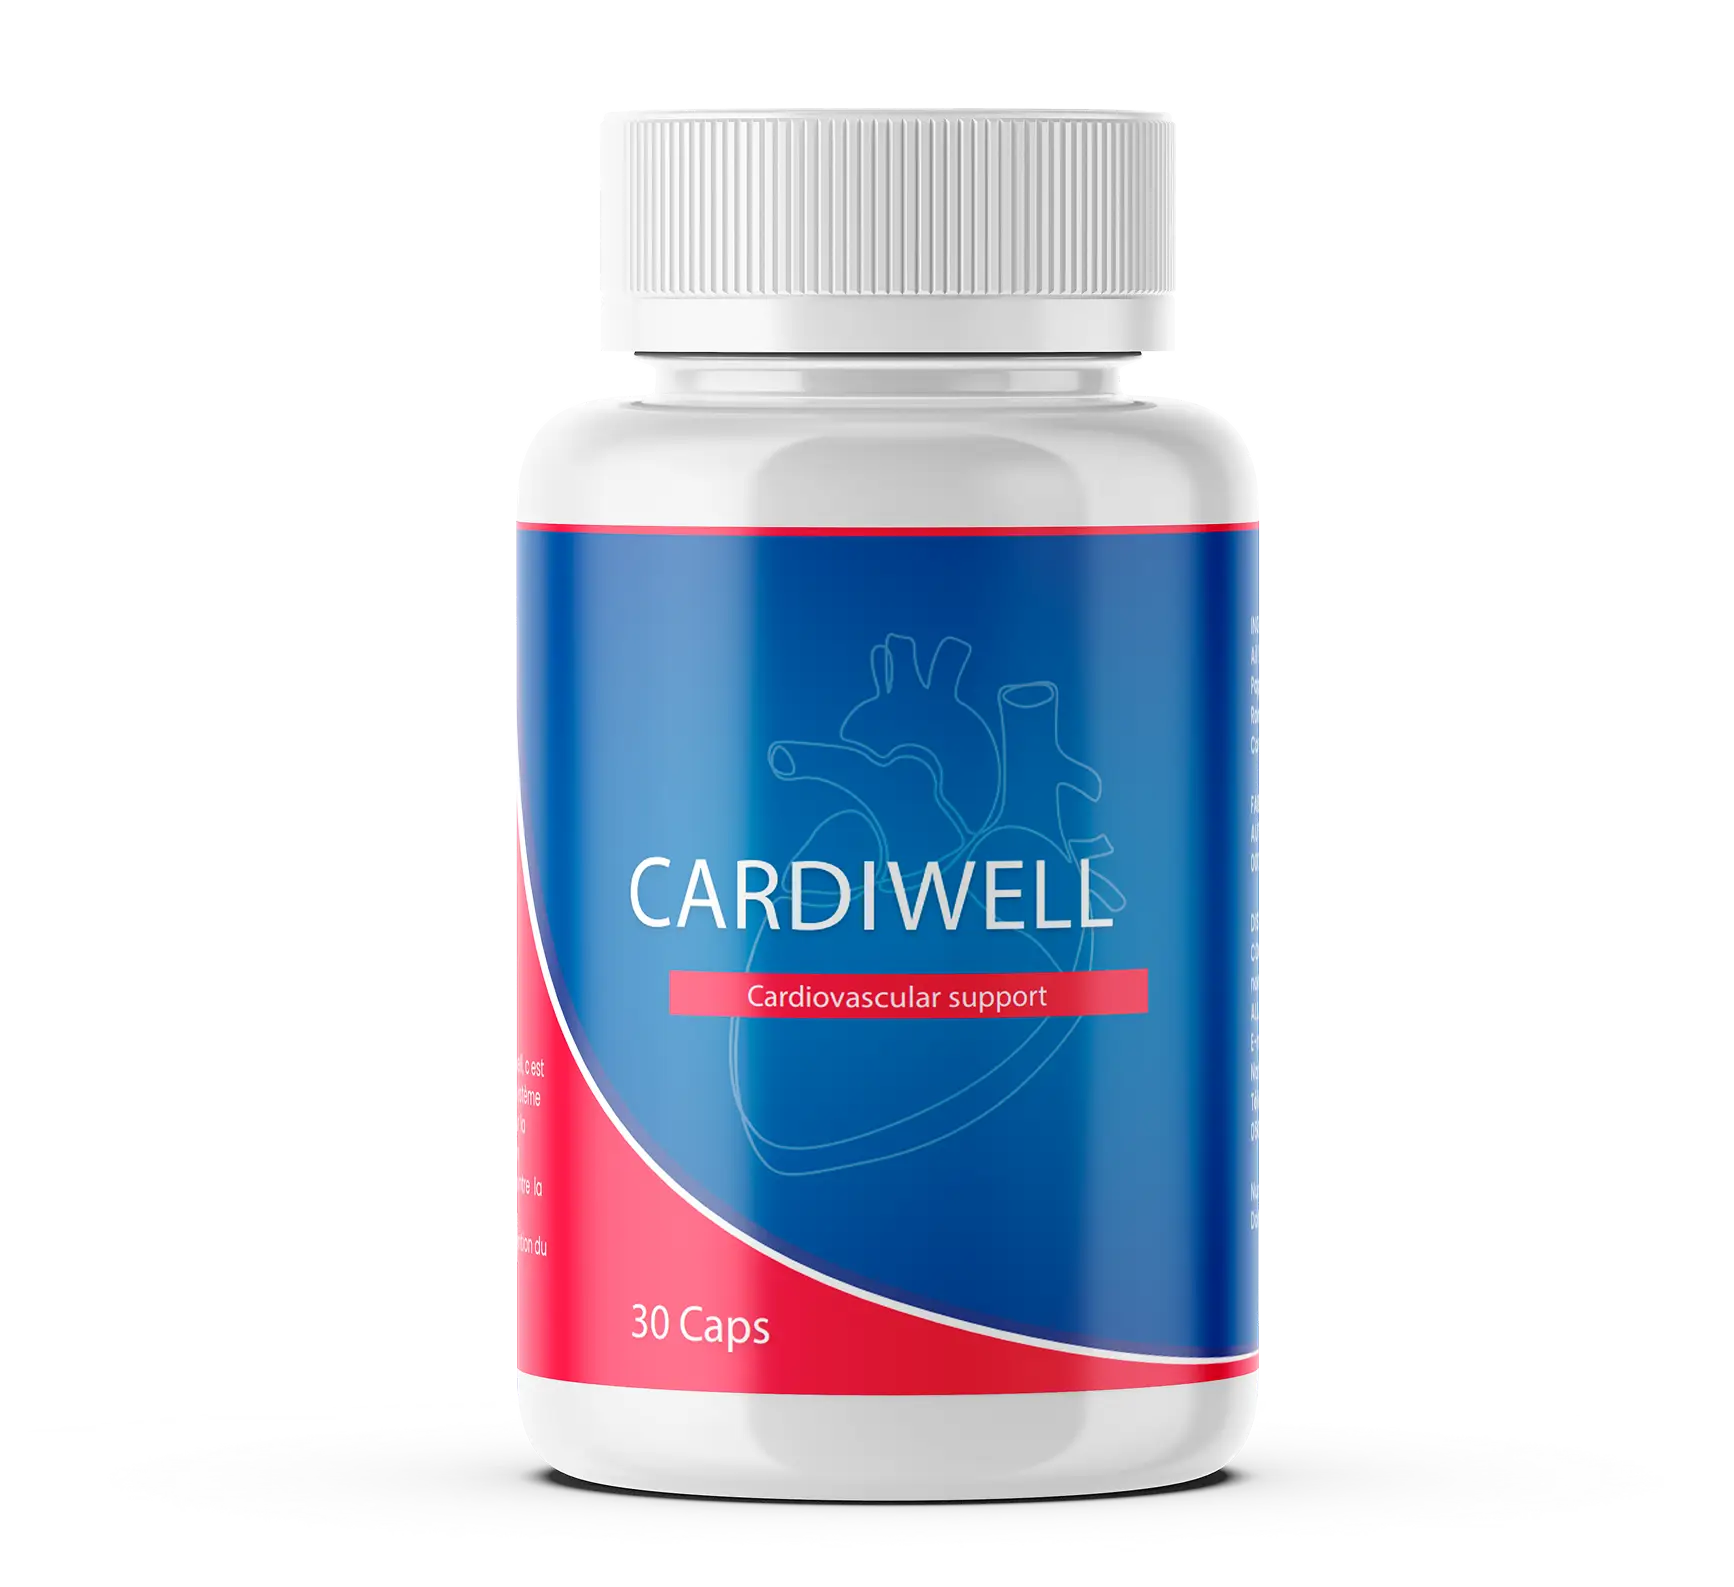
$18
/lead
Prostatitis
Tanzania
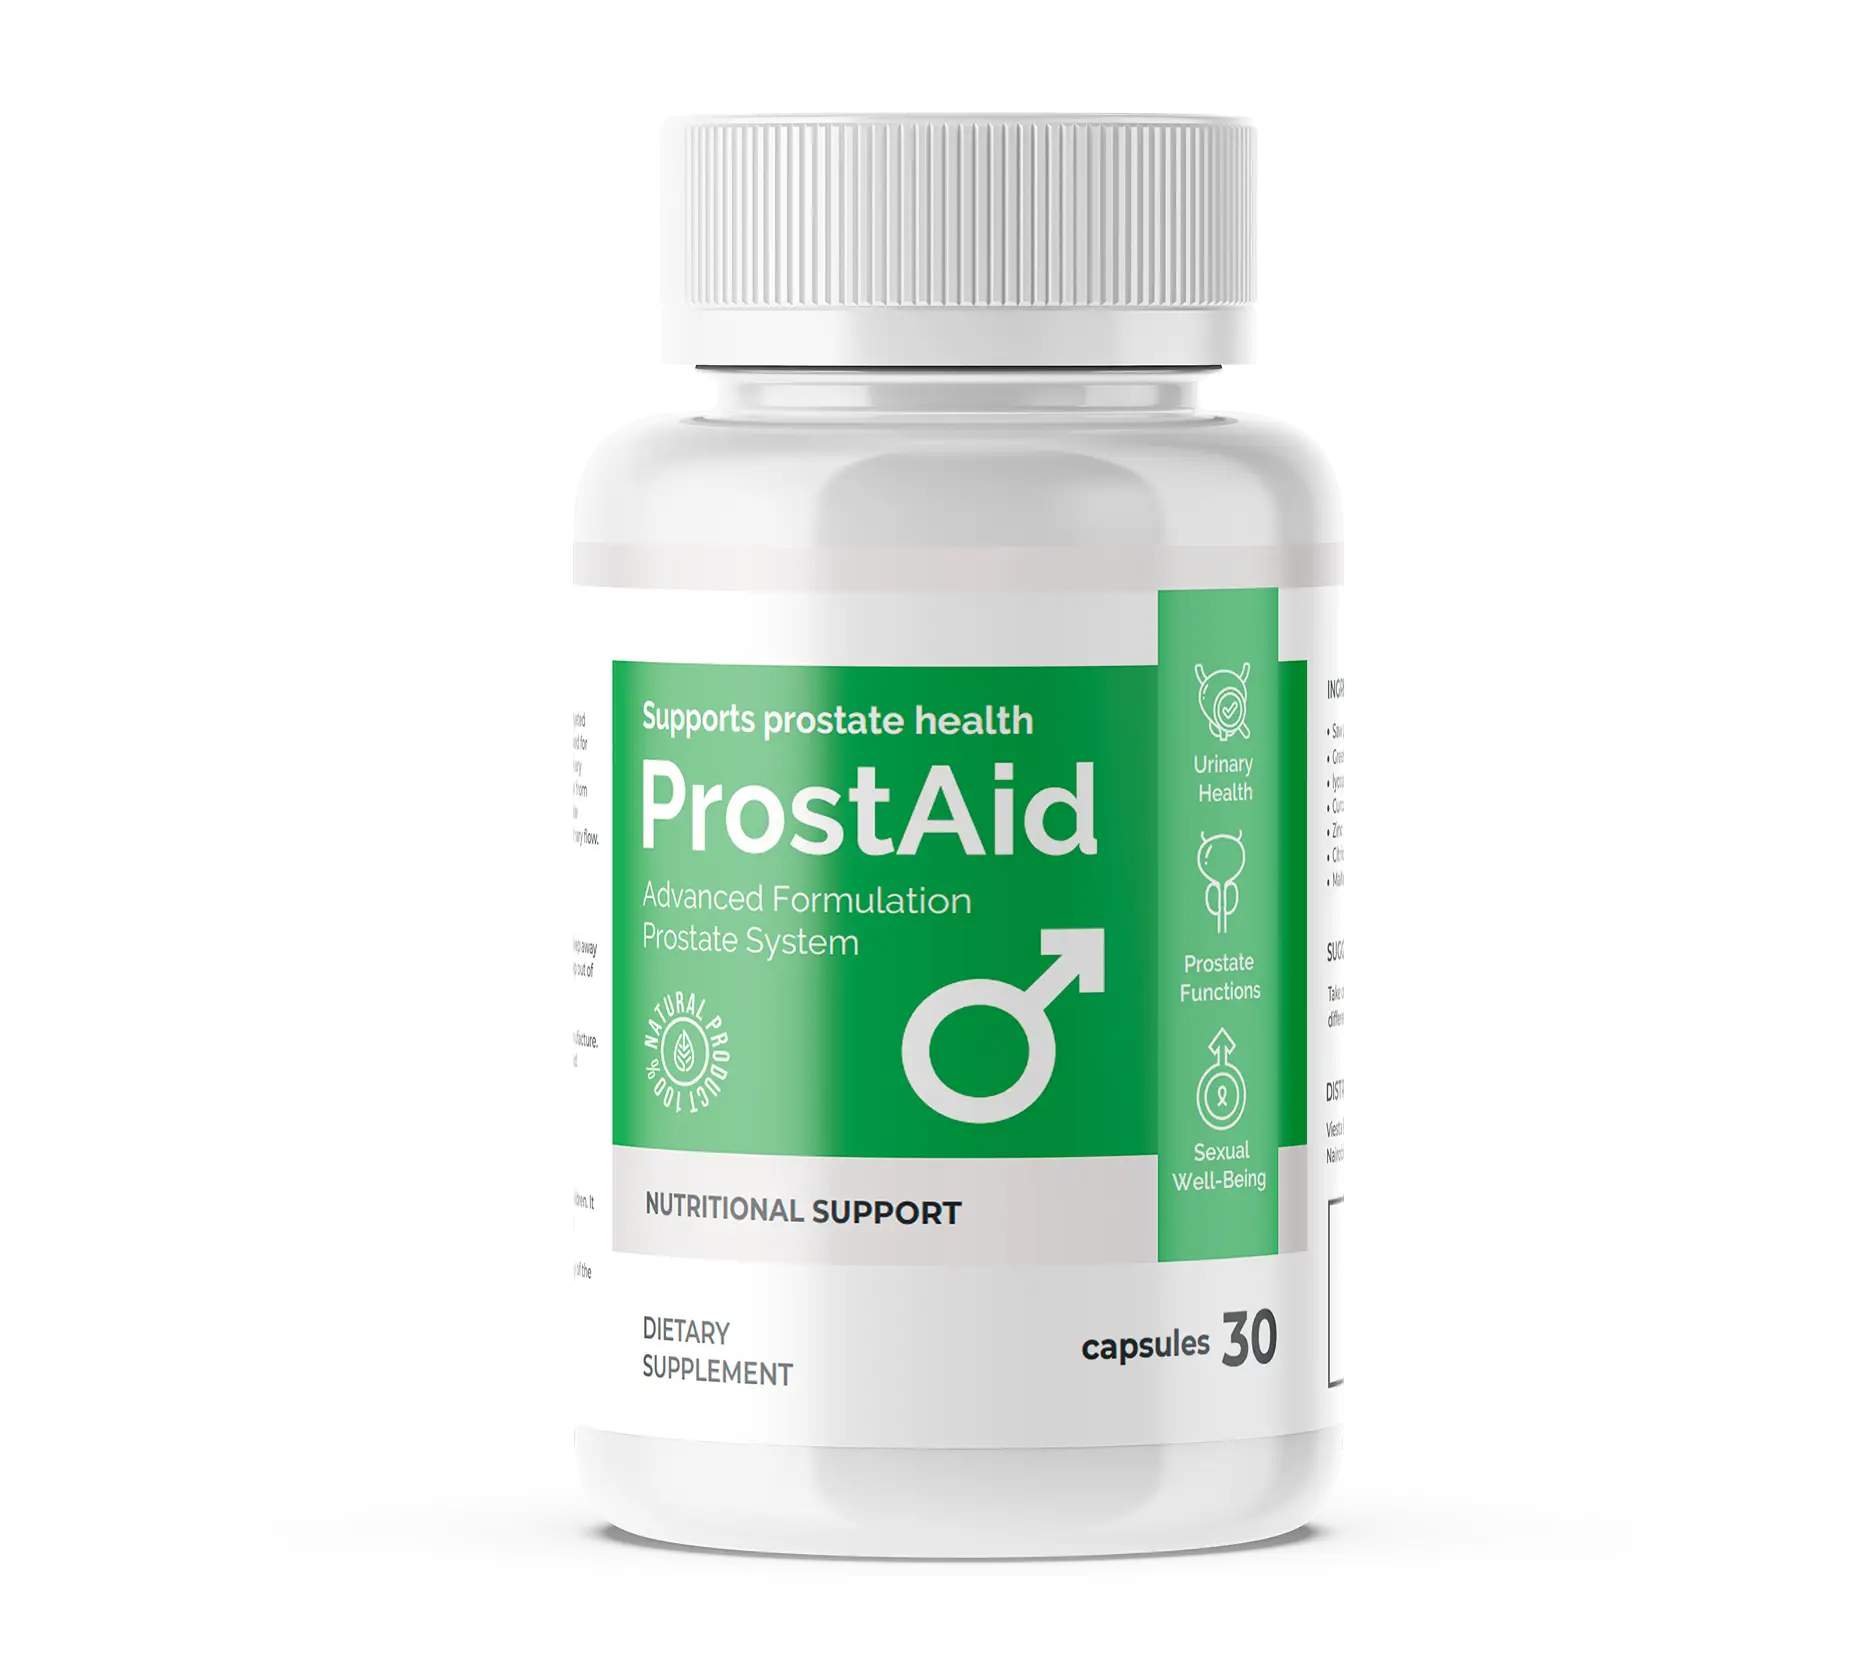
$15
/lead
Prostatits
Tunisia
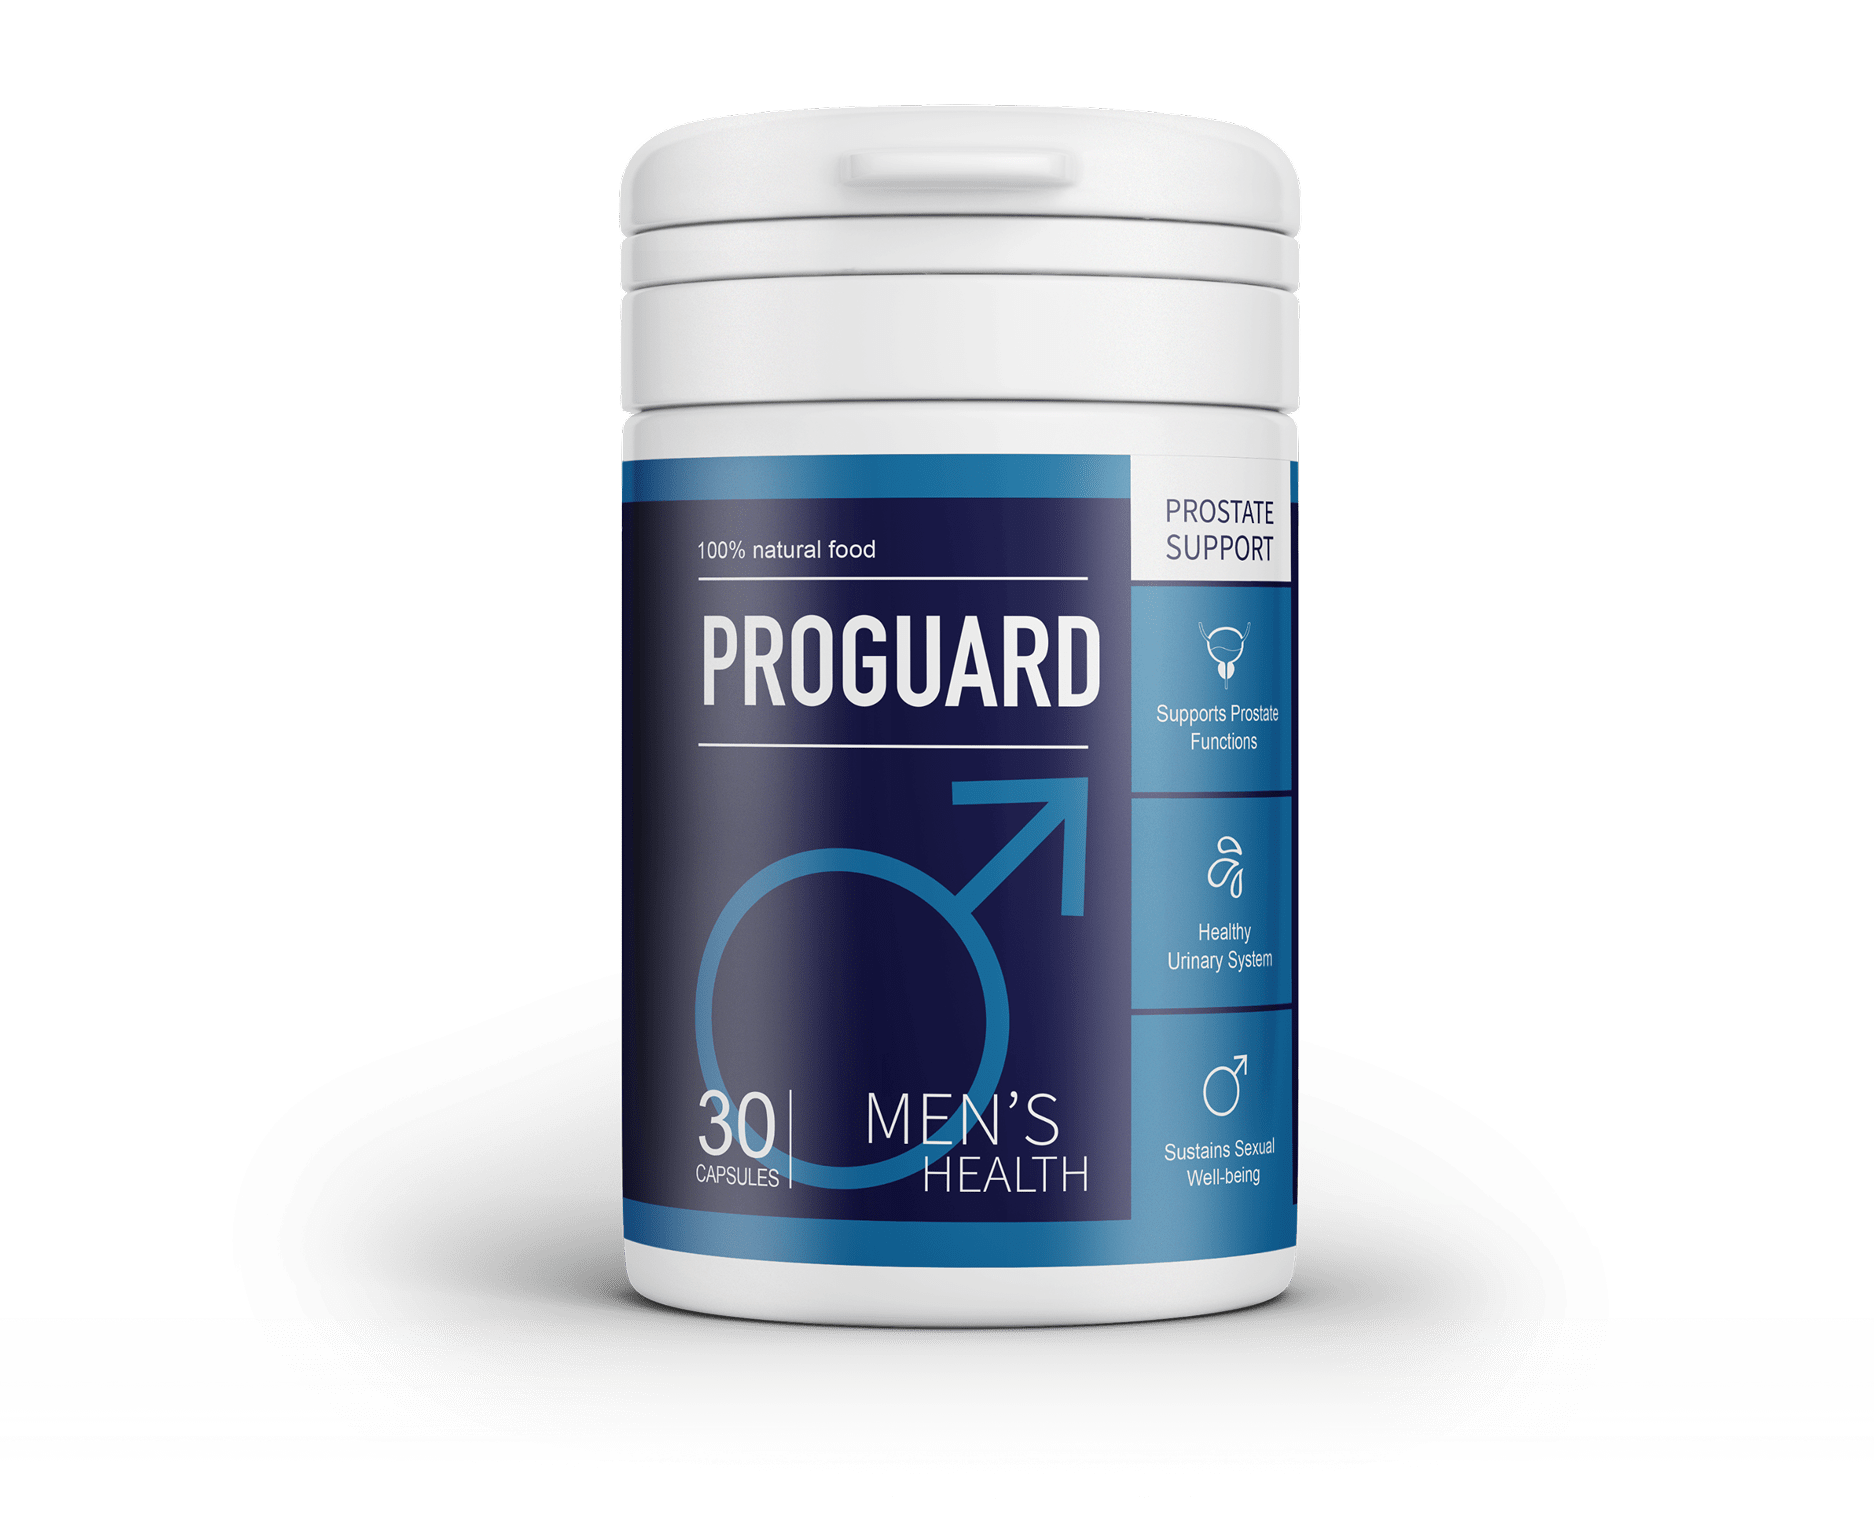
$17
/lead
Diabetes
Ivory Coast
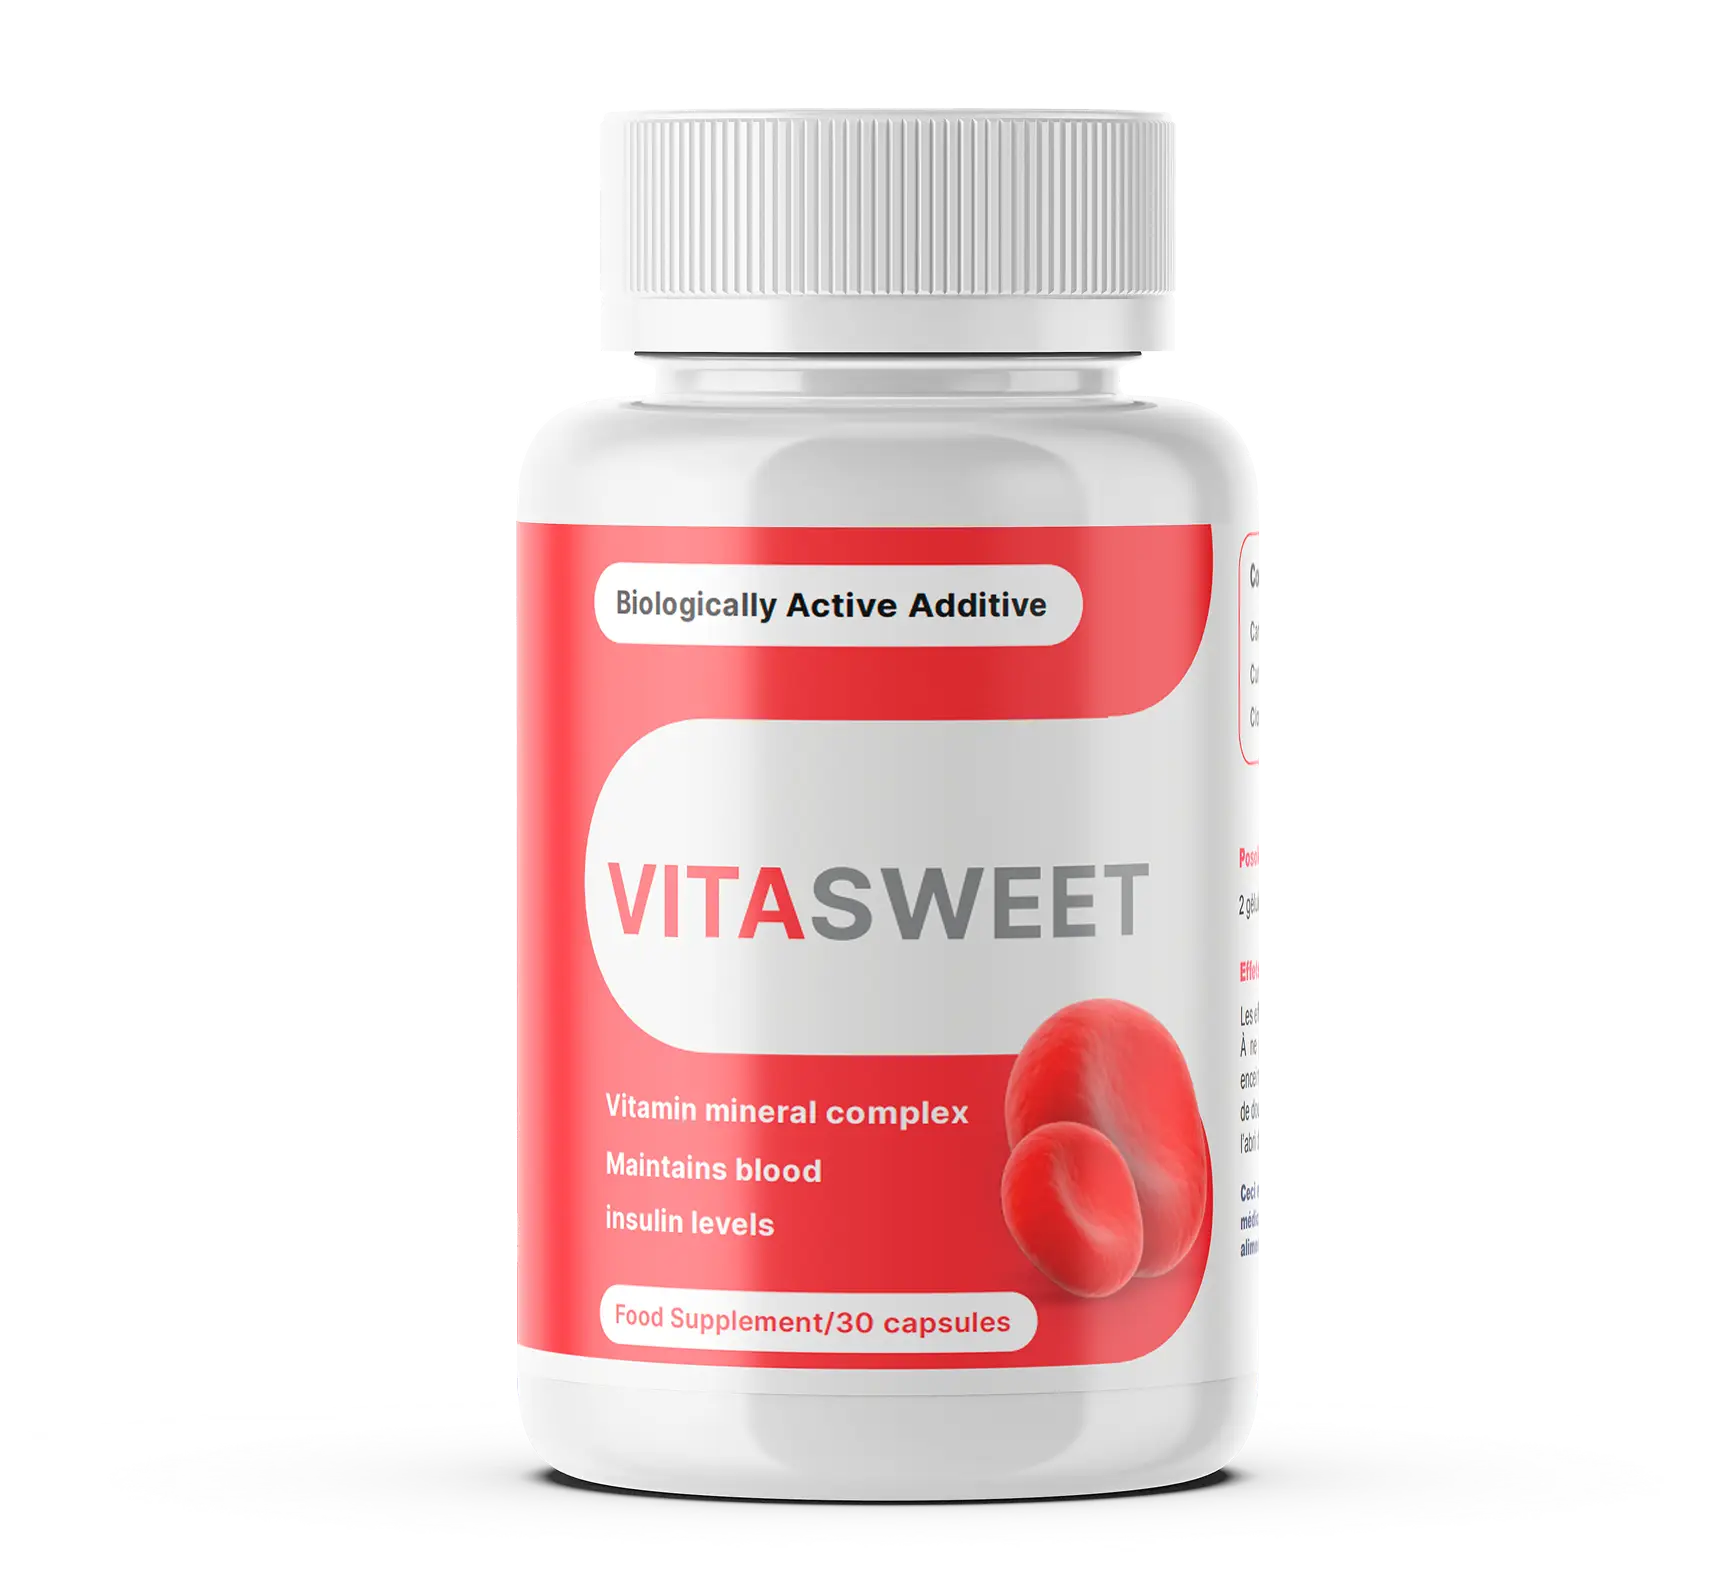
$21
/lead